

How to Measure Peptide Concentration: Methods Guide
For most proteomics workflows, the right answer depends on three variables: required accuracy, available equipment, and whether the sample must survive the measurement. Use LC-MS with stable-isotope dilution (AQUA/SID) for absolute quantitation, AAA or qNMR for reference-standard value assignment, and tryptophan fluorescence or A205/A280 for fast routine checks.
Quick method-to-use-case mapping:
- Publication-grade absolute quantitation: AQUA/SID peptides with MRM/SRM on a triple quadrupole or high-resolution instrument
- Reference-standard value assignment: Amino acid analysis (AAA) or qNMR as primary methods, with HPLC as a cross-check
- Routine digest QC before LC-MS injection: Tryptophan fluorescence (non-destructive, sample-recoverable) or A205 when no aromatics are present
- Peptides with Trp/Tyr residues, fast check: A280 with a calculated extinction coefficient
- Trace-level endogenous peptides in plasma or tissue: LC-MS AQUA/SID; colorimetric assays are not sensitive enough
Quick exclusion rules:
- Skip A280 when the peptide lacks Trp, Tyr, or Cys-Cys disulfide bonds; the signal will be near zero or unreliable
- Avoid colorimetric assays (BCA, Bradford, Lowry) when downstream LC-MS is planned; reagent carryover can suppress ionization
- Do not rely on pre-digestion protein estimates as a substitute for direct peptide quantitation; direct peptide assays give better control for MS workflows
Key Takeaways
Absolute quantitation by AAA, qNMR, or AQUA/SID is required for any peptide used as a calibrator or reference standard; relative methods are appropriate only for routine QC checks and relative comparisons.
| Point | Details |
|---|---|
| Match method to purpose | Use AQUA/SID for absolute LC-MS quantitation; tryptophan fluorescence or A280 for fast routine checks. |
| Pre-analytics first | Adsorption and container choice cause more measurement error than method selection; run a serial-transfer test at the LLOQ. |
| AAA/qNMR for value assignment | For reference standards, AAA delivers r² ≥ 0.997 and %CVs ≤ 10%; qNMR gives absolute molar concentration without a calibration curve. |
| Report validation parameters | Include LOD/LOQ, linearity r², intra/inter-assay %CV, and spike recovery in every publication or SOP. |
| Purity correction is required | Apply HPLC purity data from the COA to nominal concentration before preparing calibrators or spike-ins. |
Table of Contents
- How do you measure peptide concentration accurately?
- UV absorbance at A280, A205, and tryptophan fluorescence
- Colorimetric assays for peptides: BCA, Bradford, Lowry, and peptide-specific kits
- Amino acid analysis and qNMR for absolute quantitation
- LC-MS quantitation: AQUA/SID, MRM/SRM, and label-free approaches
- Pre-analytics checklist: what to do before you measure
- Which method should you use for your experiment?
- Formulas and worked examples for peptide concentration calculations
- Diagnosing and fixing common measurement failures
- Validation and reporting requirements for publication or QC
- What the inter-laboratory data says about method reproducibility
- A few practical notes on integrating quantitation into real workflows
- Sources
How do you measure peptide concentration accurately?
The table below maps each major peptide quantification method against the dimensions that matter most at the bench.
| Method | Sensitivity / Dynamic Range | Absolute vs. Relative | Destructive? | LC-MS Compatible? | Throughput | Equipment / Cost | Matrix Tolerance |
|---|---|---|---|---|---|---|---|
| A280 UV absorbance | µg/mL range; narrow | Relative (needs ε) | No | Yes | High / fast | UV spectrophotometer / low | Moderate; fails with UV-absorbing buffers |
| A205 / Waddell | µg/mL range | Relative | No | Yes | High / fast | UV spectrophotometer / low | Poor; many solvents absorb at 205 nm |
| Tryptophan fluorescence | Sub-µg/mL; wide | Relative | No | Yes | High / fast | Fluorometer or plate reader / low | Good; tolerates many buffers |
| BCA assay | 20 µg/mL | Relative | Yes | No (reagent contamination) | Medium | Plate reader / low | Moderate; detergents interfere |
| Bradford assay | 1–1,500 µg/mL | Relative | Yes | No | Medium | Plate reader / low | Poor; detergents and basic buffers interfere |
| Lowry assay | 5–100 µg/mL | Relative | Yes | No | Low / slow | Plate reader / low | Poor; many reagents interfere |
| Pierce Peptide Assay | 5–200 µg/mL | Relative | Yes | No | Medium | Plate reader / low | Better than Bradford for peptides |
| AAA | pmol–nmol range | Absolute | Yes (hydrolysis) | Yes (post-analysis) | Low / 24–48 h | LC-MS or HPLC / high | Excellent; sequence-level confirmation |
| qNMR | µg–mg range | Absolute | No | Yes | Low / hours | NMR spectrometer / very high | Excellent; direct measurement |
| AQUA/SID LC-MS | fmol–pmol range | Absolute | Yes | Native | Medium | Triple-quad or high-res MS / high | Excellent; matrix-matched |
| MRM/SRM label-free | fmol–pmol range | Relative | Yes | Native | Medium | Triple-quad / high | Moderate; ionization differences apply |
Key insight: No single method covers every scenario. The most defensible quantitation strategy pairs a fast routine check (tryptophan fluorescence or A280) with a primary absolute method (AAA, qNMR, or AQUA/SID) for any sample that will be used as a calibrator or spike-in standard.
Mini decision matrix for common scenarios:
- Reference-standard value assignment: AAA or qNMR as primary; HPLC as cross-check
- Proteomics spike-in calibration: AQUA/SID with MRM/SRM
- Routine tryptic digest QC: Tryptophan fluorescence or A280 (if Trp/Tyr present)
- Low-picomolar endogenous analytes: AQUA/SID; label-free MRM only if SID is unavailable
UV absorbance at A280, A205, and tryptophan fluorescence
A280 is the fastest non-destructive check available, but it only works when the peptide contains Trp, Tyr, or a disulfide bond. The calculation follows Beer-Lambert:
A = ε × c × l
where A is absorbance (unitless), ε is the molar extinction coefficient (M⁻¹cm⁻¹), c is concentration (M), and l is pathlength (cm, typically 1 cm for a standard cuvette or 0.1 cm for a NanoDrop-style instrument).
Worked example: converting mass to molarity via A280
Suppose you have a lyophilized peptide with MW = 1,500 g/mol and ε₂₈₀ = 5,500 M⁻¹cm⁻¹ (one Trp residue).
- Rearrange Beer-Lambert: c = A / (ε × l) = 0.275 / (5,500 × 1) = 5.0 × 10⁻⁵ M = 50 µM
- Convert to mg/mL: 50 × 10⁻⁶ mol/L × 1,500 g/mol = 0.075 g/L = 0.075 mg/mL
For micro-volume instruments (NanoDrop), apply the manufacturer’s pathlength correction factor before calculating concentration.
When A280 fails and what to use instead
- Peptides with no Trp, Tyr, or disulfide: ε₂₈₀ ≈ 0; use A205 (Waddell method) or tryptophan fluorescence
- A205 measures the peptide bond directly, but the Waddell method requires A₂₁₅ < 0.5 to maintain linearity; dilute samples above that threshold
- Buffers containing imidazole, DTT, TCEP, urea > 1 M, or Tris absorb at 205 nm and invalidate A205 readings
- Detergents (SDS, Triton X-100) interfere with both A280 and A205
Common interferences to check before measuring:
- Nucleic acid contamination (absorbs at 260 nm, bleeds into 280 nm)
- High concentrations of urea or guanidinium
- Organic solvents (acetonitrile, DMSO above ~5%)
- Residual TFA from synthesis
Tryptophan fluorescence as a non-destructive alternative
Tryptophan fluorescence provides a simple, sensitive, non-destructive method for peptide quantitation and allows full sample recovery after measurement. Excite at 280 nm, read emission at 350 nm. Sensitivity reaches sub-µg/mL levels in diluted digests, making it practical for proteomic sample checks where sample volume is limited. Because the sample is not consumed, you can measure concentration, then inject the same aliquot directly onto the LC column.
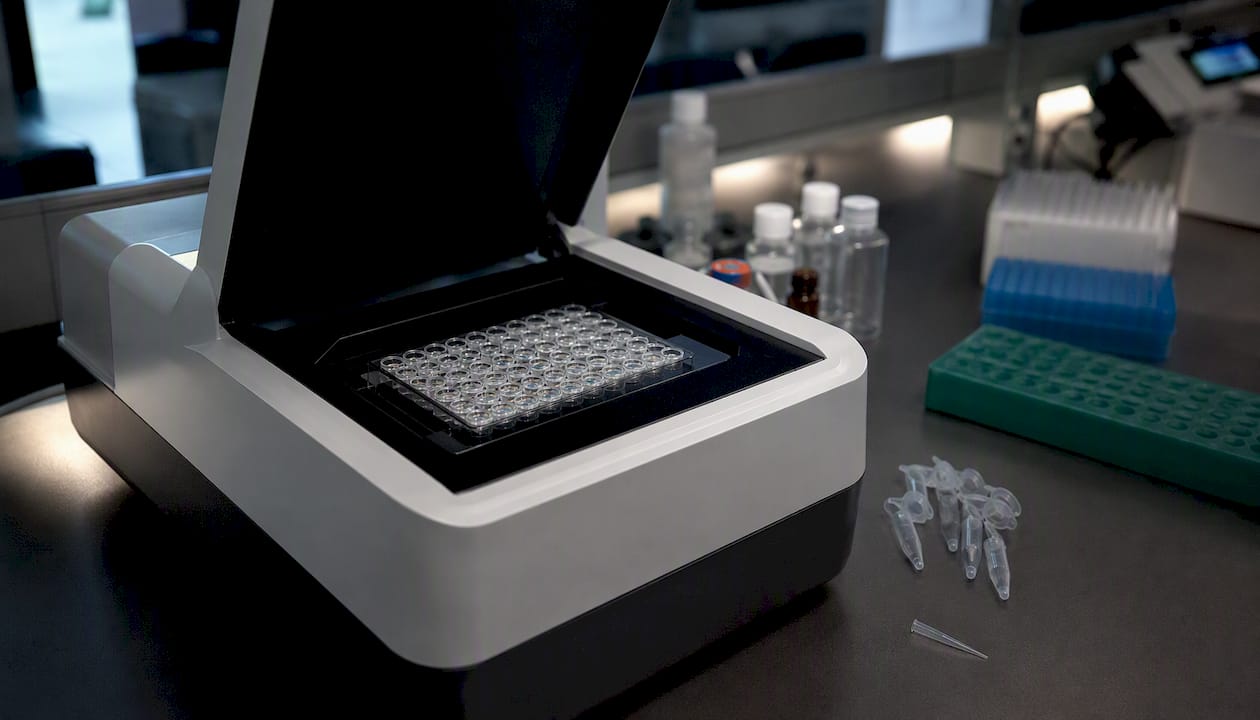
Pro Tip: When using tryptophan fluorescence on a plate reader, prepare a standard curve from a Trp-containing reference peptide of similar sequence length. A BSA-based standard curve will underestimate concentration for short peptides because the Trp quantum yield varies with local sequence context.
Colorimetric assays for peptides: BCA, Bradford, Lowry, and peptide-specific kits
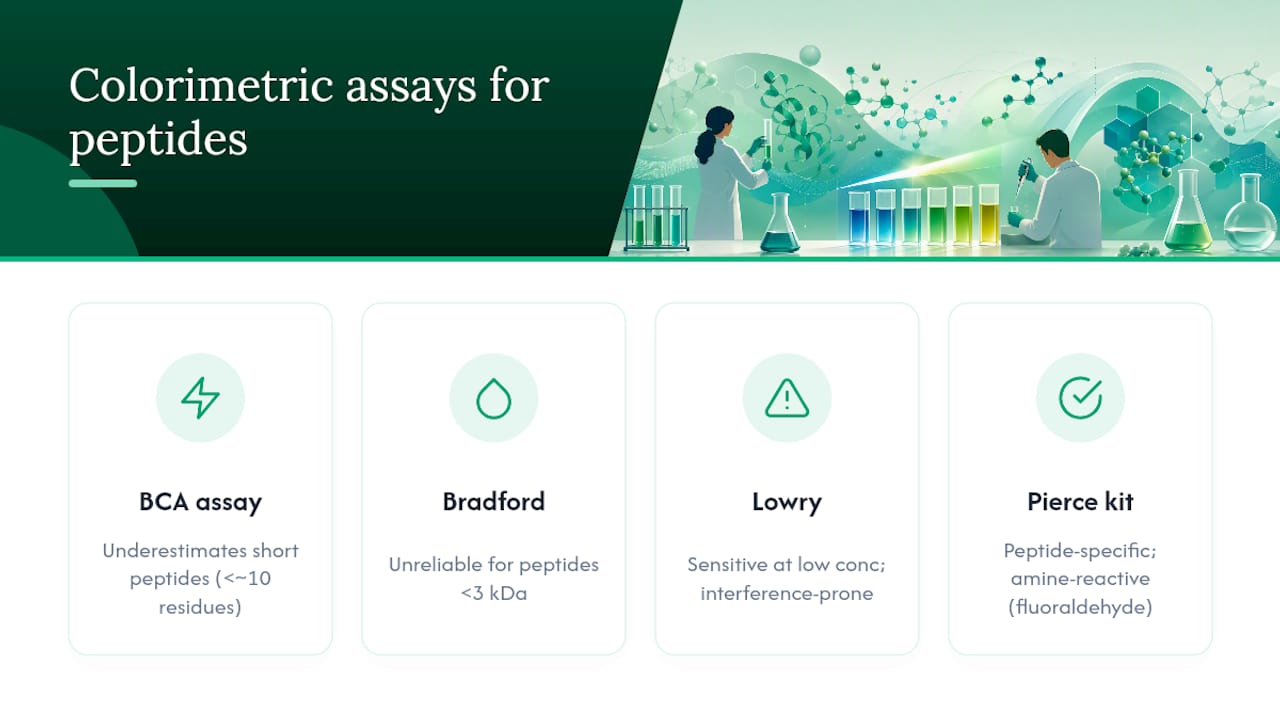
Colorimetric assays are accessible and require only a plate reader, but most were designed for intact proteins, not peptides. Understanding where each one breaks down saves time and prevents systematic errors.
BCA (bicinchoninic acid) assay detects the Cu²⁺ reduction product of peptide bonds and is more tolerant of detergents than Bradford. It works reasonably well for peptides above ~10 residues, but short peptides produce weaker signal per unit mass than BSA standards, leading to underestimation. The assay is destructive and the copper-BCA complex can suppress ESI ionization if carryover reaches the LC-MS.
Bradford assay (Coomassie G-250 binding) is highly sensitive for intact proteins but notoriously unreliable for peptides below ~3 kDa. The dye binds primarily to Arg and hydrophobic clusters; short peptides with few such residues give poor signal. Basic buffers and detergents cause false positives.
Lowry assay combines Folin-Ciocalteu reagent with alkaline copper reduction. It is more sensitive than BCA at low concentrations but has the longest protocol and the most interference-prone chemistry. Reducing agents (DTT, 2-ME), EDTA, and many common buffers require removal before measurement.
Pierce Quantitative Colorimetric Peptide Assay (Thermo Fisher) is specifically formulated for peptide samples rather than intact proteins. It uses a fluoraldehyde-based reaction with primary amines and gives more consistent results across peptides of varying size and composition than Bradford or BCA. Still destructive, and still not recommended when the same sample must proceed to LC-MS.
Critical consideration for MS workflows: Colorimetric reagents are not volatile and do not elute cleanly from reversed-phase columns. Even trace BCA or Bradford dye in an LC-MS injection can cause ion suppression, column contamination, and carry-over. If the sample will go to LC-MS, use tryptophan fluorescence, A280, or a separate aliquot for colorimetric measurement.
Calibration curve guidance applies to all colorimetric methods: use a peptide standard that matches your analyte in amino acid composition where possible. BSA is a convenient standard but introduces systematic error for short peptides because the color yield per microgram differs. For the Pierce peptide assay, a peptide standard of known concentration (confirmed by AAA or qNMR) gives the most accurate calibration.
Amino acid analysis and qNMR for absolute quantitation
When a peptide will serve as a reference standard, spike-in calibrator, or inter-laboratory control, relative methods are not sufficient. AAA and qNMR are the two primary absolute quantitation tools.
AAA workflow
- Hydrolyze the peptide: typically 6 M HCl, 110°C, 20–24 hours under nitrogen or vacuum
- Add isotopically labeled amino acid internal standards (e.g., ¹³C/¹⁵N-labeled Ala, Leu, Phe) before hydrolysis to correct for hydrolysis losses
- Separate hydrolysate by reversed-phase UPLC or ion-exchange HPLC
- Detect by UV (post-column ninhydrin or OPA derivatization) or by MRM-MS for higher sensitivity
- Calculate concentration by averaging results across multiple amino acid residues; discard Trp (destroyed by acid hydrolysis) and Cys (requires separate oxidative hydrolysis)
A reversed-phase UPLC-MRM-MS approach to AAA delivers r² ≥ 0.997 linearity and intra/inter-day %CVs ≤ 10% for peptide concentration determinations, making it a reliable primary method when properly validated.
Known AAA limitations:
- Trp is destroyed under standard acid hydrolysis; use alkaline hydrolysis or spectroscopic correction
- Asn and Gln are converted to Asp and Glu during hydrolysis; report as Asx/Glx
- Incomplete hydrolysis of Val-Val, Ile-Ile, and similar sterically hindered bonds requires extended hydrolysis time
- High-throughput is limited; typical turnaround is 24–48 hours per batch
qNMR basics and advantages
Quantitative NMR measures signal intensity directly proportional to the number of nuclei resonating at a given frequency. Against a certified internal standard (e.g., DMSO-d₆ with a known concentration of 3-(trimethylsilyl)propionic acid, or a USP-grade reference), qNMR gives absolute molar concentration without a calibration curve. Analysis time is shorter than AAA (hours vs. days), and the sample is not destroyed. The main barriers are instrument access (600 MHz or higher is preferred for peptide work) and the requirement for a clean, well-resolved spectrum, which can be challenging for large or aggregation-prone peptides.
Recommended acceptance thresholds for AAA/qNMR value assignment:
- Linearity: r² ≥ 0.995 across the working range
- Intra-assay %CV: ≤ 5% for AAA; ≤ 3% for qNMR at adequate signal-to-noise
- Inter-assay %CV: ≤ 10% for AAA; ≤ 5% for qNMR
- Spike recovery: 95–105% for both methods
LC-MS quantitation: AQUA/SID, MRM/SRM, and label-free approaches
For absolute quantitation of endogenous peptides or spike-in calibrators in complex matrices, stable-isotope dilution using AQUA peptides is the most reliable LC-MS approach. Label-free MRM can work for relative comparisons but requires careful normalization and carries higher inter-run variability.
Stepwise AQUA/SID workflow
- Select target peptides: choose tryptic peptides of 8–20 residues, unique to the protein of interest, free of missed cleavages, Met oxidation sites, and N-terminal Gln (prone to cyclization)
- Synthesize heavy-labeled analogs: incorporate stable isotopes (¹³C/¹⁵N) at the C-terminal Lys or Arg; confirm identity and purity by LC-MS before use
- Determine spike-in level: dilute AQUA peptides into peptide loading buffer to approximately 10–100 fmol/µL for method development; spike at a level bracketing the expected endogenous concentration
- Optimize LC method: use a gradient that resolves the light/heavy pair; co-elution is required for accurate peak-area ratios
- Select transitions (SRM): choose 2–3 product ions per peptide; use the most abundant, interference-free transitions for quantitation and at least one for confirmation
- Calculate concentration: divide the peak area of the endogenous (light) peptide by the peak area of the heavy standard; multiply by the known spike-in amount
Well-designed AQUA experiments commonly report CVs in the single digits to mid-teens for triplicate measurements. SID/MRM methods can produce intralaboratory CVs well below 10% (often below 5%) at higher concentrations, but variability increases near the LLOQ. Plan replicates accordingly: three technical replicates at each concentration level is a practical minimum for publication.
On SIM vs. SRM: Selected ion monitoring (SIM) on a high-resolution instrument offers broader mass coverage and can detect unexpected modifications, but SRM on a triple quadrupole gives better selectivity and lower chemical noise at trace concentrations. For endogenous peptides in plasma or tissue below 100 fmol on-column, SRM is the more reliable choice.
Label-free MRM and LF approaches are acceptable for relative quantitation across a sample series when isotopically labeled standards are unavailable or cost-prohibitive. The main limitations are ionization differences between runs, digestion efficiency variability, and the absence of an internal standard to correct for matrix effects. Normalize label-free data to total peptide signal or to a stable housekeeping protein to reduce run-to-run drift.
Pro Tip: Spike AQUA peptides into the digestion mixture before cleanup, not after. This approach corrects for losses during solid-phase extraction or desalting, giving a more accurate recovery-corrected concentration.
Pre-analytics checklist: what to do before you measure
Pre-analytical factors such as adsorption to containers and sample handling are a major source of measurement error, often more consequential than the choice of analytical method. Address these before running any quantitation assay.
Stock preparation and storage
- Reconstitute lyophilized peptides in a solvent that matches the peptide’s physicochemical properties; hydrophobic peptides typically require an organic modifier (acetonitrile or DMSO at 5–10%) before aqueous dilution
- Prepare stock solutions at the highest practical concentration to minimize adsorption losses on a per-molecule basis
- Aliquot into single-use volumes; avoid repeated freeze-thaw cycles, which accelerate aggregation and degradation
- Store at -80°C for long-term stability; -20°C is acceptable for working stocks used within 2–4 weeks
- Label aliquots with preparation date, solvent composition, and nominal concentration
Container selection and adsorption testing
- Use low-binding polypropylene tubes (e.g., Eppendorf LoBind) for peptides below 1 µg/mL; glass is appropriate for higher concentrations but can adsorb basic peptides
- Avoid PVC and standard polyethylene for trace-level work; adsorption losses can exceed 50% at sub-nanomolar concentrations
- Perform a serial-transfer adsorption test: transfer the same solution through three consecutive tubes and measure concentration at each step; a declining signal confirms adsorption and identifies the problematic container type
- Add a carrier protein (0.1% BSA) or a compatible surfactant (0.1% Tween-20, MS-compatible detergents such as RapiGest SF) to working solutions at concentrations near the LLOQ
Surfactant and organic modifier trade-offs:
- RapiGest SF (Waters) is MS-compatible and acid-labile; it degrades during LC-MS sample prep and does not contaminate the column
- Tween-20 and Triton X-100 are not MS-compatible; use only in assays that do not proceed to LC-MS
- DMSO above 5% can suppress ESI ionization; keep it below 1% in LC-MS injections
Pro Tip: Always prepare calibrators and spike-ins in the same matrix as the study samples. A standard prepared in pure buffer will behave differently from one prepared in plasma digest or cell lysate, and the concentration difference will be attributed to the analyte rather than the matrix.
Which method should you use for your experiment?
The right peptide quantification method follows directly from four questions: What concentration range do you expect? Does the sample need to be recovered? Do you need absolute or relative accuracy? What equipment is available?
Decision anchor: If you need a number you can defend in a publication or use to calibrate another assay, absolute quantitation by AAA, qNMR, or AQUA/SID is required. Relative methods (A280, colorimetric, label-free MS) are appropriate for QC checks and relative comparisons, not for value assignment.
| Scenario | Recommended method | Key constraint |
|---|---|---|
| Low-pM endogenous peptide in plasma | AQUA/SID with MRM/SRM | Requires heavy-labeled standard |
| Routine tryptic digest QC | Tryptophan fluorescence or A280 | Peptide must contain Trp/Tyr for A280 |
| Reference-standard value assignment | AAA (primary) + qNMR (orthogonal) | 24–48 h turnaround; NMR access |
| Peptide lacking aromatics, fast check | A205 (Waddell); keep A₂₁₅ < 0.5 | Buffer must not absorb at 205 nm |
| High-throughput digest normalization | Pierce Peptide Assay or BCA | Not for LC-MS direct injection |
| Relative quantitation across samples | Label-free MRM with normalization | Higher inter-run CV than SID |
Operational constraints to factor in:
- Turnaround: A280 and tryptophan fluorescence give results in minutes; AAA requires 24–48 hours; qNMR requires 2–4 hours of instrument time plus data processing
- Cost per sample: UV methods are near-zero marginal cost; AQUA peptide synthesis adds $200–$600 per peptide depending on length and isotope incorporation (pricing varies by vendor and is not publicly listed by all suppliers)
- Throughput: colorimetric plate-reader assays handle 96 samples per run; AAA and qNMR are low-throughput by comparison
Estimating peptide concentration from pre-digestion protein measurements is a common shortcut but not an adequate substitute for direct peptide quantitation in MS workflows.
Formulas and worked examples for peptide concentration calculations
Core formulas
Molarity from mass:
c (µM) = [mass (µg) / MW (g/mol)] × (1 / volume (mL)) × 1,000
Beer-Lambert law:
c (M) = A / (ε × l)
where A = absorbance, ε = molar extinction coefficient (M⁻¹cm⁻¹), l = pathlength (cm)
Dilution:
C₁V₁ = C₂V₂
Worked example: lyophilized peptide to working solution
A lyophilized peptide (MW = 2,200 g/mol, one Tyr residue, ε₂₈₀ = 1,490 M⁻¹cm⁻¹) is supplied at a nominal 5 mg.
- Nominal stock concentration: 5 mg / 1 mL = 5 mg/mL
- Convert to molarity: (5 mg/mL) / (2,200 g/mol) × 1,000 = 2.27 mM (nominal)
- Verify by A280: dilute 1:100 in water; read A₂₈₀ = 0.310 at 1 cm pathlength
- Actual concentration of diluted sample: 0.310 / (1,490 × 1) = 2.08 × 10⁻⁴ M = 208 µM
- Actual stock concentration: 208 µM × 100 = 20.8 mM — wait, that exceeds the nominal; check for a pathlength error or confirm the NanoDrop correction factor is applied
- Corrected (NanoDrop 0.1 mm pathlength): multiply raw NanoDrop reading by 10 to get 1 cm equivalent, then recalculate
This kind of discrepancy is common when pathlength corrections are missed. Always confirm the instrument’s pathlength setting before calculating concentration. For a step-by-step reconstitution calculator, the Neolabpeptides reconstitution guide walks through these conversions with practical examples.
Example conversion table
Caveats before running calculations:
- Extinction coefficients are unreliable for peptides with no aromatic residues; use AAA or qNMR instead
- Folded or aggregated peptides may have buried chromophores; denature in 6 M guanidinium before A280 measurement
- Pathlength errors are the most common source of 10-fold calculation mistakes on micro-volume instruments
- Purity affects nominal concentration; a peptide at 90% purity by HPLC requires a purity correction factor when calculating actual molar concentration. Review the COA interpretation guide from Neolabpeptides for guidance on applying HPLC purity data to concentration calculations
Diagnosing and fixing common measurement failures
Inconsistent results across methods almost always trace back to one of four root causes: adsorption, an interfering chromophore or reagent, incomplete hydrolysis (for AAA), or a pathlength/calculation error.
Diagnostic rule: When A280 and LC-MS give concentrations that differ by more than 20%, adsorption or a chromophore interference is the most likely cause. When AAA and A280 agree but LC-MS gives a lower number, check for ionization suppression or incomplete digestion rather than a concentration error.
Stepwise diagnostic approach:
- Rerun A280 after diluting into a clean buffer free of UV-absorbing components; if the reading changes disproportionately, a buffer interference is present
- Perform a spike-recovery experiment: add a known amount of the same peptide to the sample matrix and measure recovery; below 80% recovery indicates adsorption or matrix suppression
- Test multiple container materials (standard polypropylene vs. LoBind vs. glass) at the expected LLOQ concentration; a serial-transfer test as described in the pre-analytics tutorial quantifies adsorption directly
- Add 0.1% BSA or a compatible surfactant to the diluent and retest; recovery improvement confirms adsorption as the root cause
- If results remain inconsistent across A280, colorimetric, and LC-MS, escalate to AAA or qNMR as an orthogonal absolute method
When to use third-party testing: For any peptide that will serve as a reference material distributed across multiple labs, internal HPLC or A280 measurements are not sufficient. Commission an independent AAA or qNMR value assignment from a qualified analytical laboratory. Neolabpeptides provides third-party testing documentation with all research-grade peptides, including HPLC and MS-based purity and identity data.
For LC-MS samples, use RapiGest SF instead. It prevents adsorption and degrades during sample prep without contaminating the column.
Validation and reporting requirements for publication or QC
A concentration measurement is only as defensible as its documentation. Whether you are writing a methods section or building an SOP, include the following minimum elements.
Validation checklist:
- LOD and LOQ: determined by signal-to-noise (S/N ≥ 3 for LOD, S/N ≥ 10 for LOQ) or by back-calculation from the calibration curve
- Linearity: r² ≥ 0.995 across the working range; report the range explicitly
- Intra-assay %CV: ≤ 5% for absolute methods (AAA, qNMR, AQUA/SID); ≤ 10% for relative methods
- Inter-assay %CV: ≤ 10% for absolute methods; ≤ 15% for relative methods
- Spike recovery: 85–115% is acceptable for most biological matrices; 95–105% for reference-standard work
- Stability data: freeze-thaw stability (minimum three cycles), bench-top stability (4–8 hours), and long-term storage stability at -20°C and -80°C
- Calibrator identity and traceability: lot number, source, purity by HPLC, and value-assignment method
Reporting in publications:
- State the quantitation method and instrument settings (wavelength, pathlength, excitation/emission for fluorescence, MRM transitions for LC-MS)
- Report results as mean ± SD with the number of replicates; for LC-MS, include peak-area ratios and the heavy-standard spike amount
- Include reagent lot numbers and container type (relevant for adsorption-sensitive peptides)
- For digestion-based workflows, report digestion efficiency and any missed-cleavage filtering criteria
- For AQUA/SID, include the heavy-peptide sequence, isotope label position, and confirmed purity
Applying purity corrections from HPLC data to concentration calculations is covered in the peptide purity guide from Neolabpeptides, which explains how to read COA data and apply it to working concentration calculations.
What the inter-laboratory data says about method reproducibility
Method choice has a measurable effect on inter-laboratory variability, and the published data on this point is worth knowing before committing to a primary quantitation strategy.
A multi-laboratory study on oxytocin reference material found that HPLC assay using the same peptide bulk as the standard yielded the lowest inter-laboratory variability compared with qNMR and AAA. This result does not mean HPLC is universally superior; it reflects the advantage of using a matched reference material that eliminates between-lab differences in standard preparation. When the same peptide bulk is not available as a reference, qNMR and AAA become the more traceable options because they do not depend on a matched standard.
Practical implication: For a peptide standard that will be used across multiple labs or time points, HPLC against the same bulk material minimizes inter-lab %CV. For a new peptide with no established bulk reference, AAA or qNMR provides the most defensible absolute value assignment. NIST and related metrology organizations document this distinction in their survey of peptide quantification methods.
Pre-analytic control is at least as important as method selection. The literature consistently identifies adsorption, sampling technique, and storage conditions as top contributors to assay failure, often exceeding the contribution of the analytical method itself. Implementing the adsorption testing and container selection steps described earlier reduces inter-lab variability before any analytical measurement is made.
For LC-MS workflows, SID/MRM methods deliver the lowest intralaboratory CVs at concentrations well above the LLOQ, but performance degrades near the detection limit. Designing experiments with spike concentrations at least 5-fold above the LLOQ is a practical way to stay in the low-CV operating range.
A few practical notes on integrating quantitation into real workflows
The formal methods literature covers what to do. What it covers less thoroughly is the sequence of decisions that determines whether a quantitation result is actually useful by the time you need it.
The most common mistake is treating concentration measurement as a final step rather than a checkpoint. Running a tryptophan fluorescence check immediately after reconstitution, before any dilution series or assay setup, catches solubility problems and pipetting errors at the point where they are cheapest to fix. By the time a concentration discrepancy shows up in an LC-MS run, you have already spent instrument time and sample.
Non-obvious tips for proteomics workflows:
- Make small-volume aliquots (5–10 µL) of your AQUA peptide working stocks; a single contaminated or evaporated tube will not compromise the entire experiment
- Test adsorption at the expected LLOQ concentration, not at the stock concentration; adsorption losses are concentration-dependent and are worst at the lowest levels you actually care about
- When preparing calibration curves, bracket the expected sample concentration rather than building a curve that starts at the LOD; this keeps your unknowns in the most linear part of the response
- For peptides with poor solubility, sonicate briefly (30 seconds in a bath sonicator) after reconstitution and centrifuge at 10,000 × g for 5 minutes before measuring; insoluble aggregates will give falsely low readings by any method
- Record the exact solvent composition, container type, and time from reconstitution to measurement in your lab notebook; these details are rarely in published methods but are often the difference between a reproducible and an irreproducible result
Sources
The sources below cover method setup, validation, and official guidance for the quantitation approaches described in this guide.
- Tutorial review for peptide assays: An ounce of pre-analytics is worth a pound of cure
- Fast and sensitive total protein and peptide assays for proteomic analysis
- Amino acid analysis for peptide quantitation using reversed-phase liquid chromatography combined with multiple reaction monitoring mass spectrometry