

Mass Spec Peptides: A Practical Primer for Beginners
Mass spec peptides basics refers to the core LC–MS/MS workflow used in proteomics: proteins are digested into peptides by trypsin, separated by nano-scale liquid chromatography, and measured by a mass spectrometer (typically an Orbitrap) that records precursor masses (MS1) and sequence-specific fragment ions (MS2) for database-driven identification. Before reading further, three things matter most: sample purity, chromatographic quality, and MS/MS spectral integrity. Get those right, and the rest of the pipeline follows logically.
Here is what a beginner should inspect first:
- Sample prep: protein extraction, reduction/alkylation, trypsin digestion, and desalting
- Chromatography: stable retention times, no column clogging, consistent peak widths
- MS/MS quality: annotated b/y ion series, signal-to-noise above background, FDR ≤1%
Worked m/z example: A peptide with a neutral mass of 1,232.55 Da carrying two protons appears in the spectrum at m/z 617.28. The formula is: (1,232.55 + 2 × 1.0073) / 2 = 617.28. Every charge state you see in an MS1 spectrum follows this same arithmetic, and the spacing between isotope peaks (1/z Da apart) tells you the charge state directly.
Neolabpeptides supplies research-grade peptides verified at ≥98% purity by HPLC and mass spectrometry, with Certificates of Analysis included, making them a reliable starting point for calibration and standard runs.
Key Takeaways
The LC–MS/MS pipeline converts proteins into identifiable peptide ions through trypsin digestion, nano-LC separation, and MS/MS fragmentation, with FDR-controlled database searching as the standard identification method.
| Point | Details |
|---|---|
| Verify peptide standards first | Check CoA for ≥95% HPLC purity, monoisotopic mass, and MS trace before any experiment. |
| Control FDR at 1% | Apply a target-decoy strategy and require ≥2 unique peptides per protein for confident IDs. |
| Know DDA vs. DIA trade-offs | DDA suits discovery; DIA gives more consistent quantitative coverage across many samples. |
| Remove salts and detergents | Ion suppression from contaminants is a top cause of failed ESI runs; desalt every sample. |
| Use FragPipe for beginners | MSFragger + Percolator + MSBooster in FragPipe is the most accessible end-to-end pipeline. |
| Source verified peptides | Neolabpeptides provides ≥98% purity peptides with third-party CoAs for research use. |
Table of Contents
- What are the basics of mass spec peptide analysis?
- Why proteomics analyzes peptides, not intact proteins
- How nano-LC separates peptides before MS detection
- How MS/MS converts spectra into peptide identifications
- DDA vs. DIA and how to quantify peptides
- How to judge whether your peptide IDs are trustworthy
- Glossary: key terms for reading methods sections
- How to verify peptide standards before running experiments
- A practical perspective for beginners starting in proteomics
- Sources
What are the basics of mass spec peptide analysis?
A mass spectrometer does one thing: it measures the mass-to-charge ratio (m/z) of ions. For peptides, that means converting molecules in solution into gas-phase charged ions, separating them by m/z, and recording a spectrum. Electrospray ionization (ESI) is the dominant method in proteomics because it couples directly to liquid chromatography and gently transfers intact peptide ions into the gas phase without destroying them.

Ion source, transfer optics, and analyzers
The instrument has four functional zones: the ion source (ESI), ion transfer optics (focusing and filtering), the mass analyzer, and the detector. Each zone shapes what you ultimately measure.
- ESI ion source: sprays a fine mist of peptide solution through a charged needle; solvent evaporates and peptides emerge as multiply charged ions ([M+nH]^n+)
- Quadrupole: four parallel rods that filter ions by m/z using oscillating electric fields; used for precursor selection in hybrid instruments
- Time-of-flight (TOF): measures how long ions take to travel a fixed distance; fast acquisition, good mass accuracy, common in high-throughput settings
- Orbitrap: ions orbit around a central electrode; Fourier transform of the oscillation frequency gives high-resolution, low-ppm mass measurements; the Orbitrap is now the mainstream analyzer in discovery proteomics
- Ion trap: traps and isolates ions for sequential fragmentation; lower resolution but fast and useful for MSn experiments
- Detector: converts ion current to a digital signal; Orbitrap instruments use image-current detection rather than a physical collector
| Analyzer | Resolution | Speed | Mass accuracy | Typical use |
|---|---|---|---|---|
| Quadrupole | Low–medium | Very fast | Moderate | Precursor selection, targeted MS |
| Ion trap | Low–medium | Fast | Moderate | MSn, rapid survey scans |
| TOF | High | Fast | Low ppm | High-throughput proteomics, intact mass |
| Orbitrap | Very high | Moderate | Sub-ppm | Discovery proteomics, PTM analysis |
The isotopic envelope visible in an MS1 spectrum is a direct consequence of natural carbon-13 abundance. Peaks separated by 1/z Da reveal the charge state: if two adjacent isotope peaks are 0.5 Da apart, the peptide carries charge +2. That same logic connects back to the m/z calculation in the opening section.
Why proteomics analyzes peptides, not intact proteins
Intact proteins are difficult to ionize reproducibly, hard to fragment into interpretable spectra, and often too large for standard LC columns. Peptides, by contrast, fall into a mass range (roughly 500–3,500 Da) that instruments handle well, produce clean multiply charged ions under ESI, and generate informative MS/MS spectra. The bottom-up LC–MS/MS workflow is the default in proteomics for exactly these reasons.
Standard sample-prep workflow
- Protein extraction: lyse cells or tissue in a compatible buffer; avoid SDS if possible, or plan for removal
- Reduction and alkylation: break disulfide bonds with DTT or TCEP, then cap cysteines with iodoacetamide to prevent re-oxidation
- Protease digestion: add trypsin (cleaves C-terminal to Arg and Lys); incubate at 37°C for 4–16 hours; typical LC–MS/MS runs last 60–120 minutes after this step
- Desalting and clean-up: use C18 solid-phase extraction tips (StageTips, Sep-Pak) to remove salts, detergents, and urea
- Optional enrichment: for phosphopeptides, use TiO₂ or IMAC; for glycopeptides, use lectin affinity; enrichment dramatically improves detection of low-abundance modifications
- Reconstitution: resuspend dried peptides in 0.1% formic acid / 2–5% acetonitrile for LC injection
Alternative proteases are available when trypsin is not ideal. Lys-C produces longer peptides and works well in urea-containing buffers; Asp-N cleaves N-terminal to aspartate and is useful for complementary sequence coverage. Most labs use trypsin alone or a Lys-C/trypsin combination.
Pro Tip: Detergents like SDS and Triton X-100 suppress electrospray ionization severely. If your protocol requires SDS for lysis, switch to an MS-compatible detergent (RapiGest, n-dodecyl-β-D-maltoside) or use a filter-aided sample preparation (FASP) protocol to remove it before digestion. Even trace amounts of SDS can suppress ionization and ruin a run.
How nano-LC separates peptides before MS detection
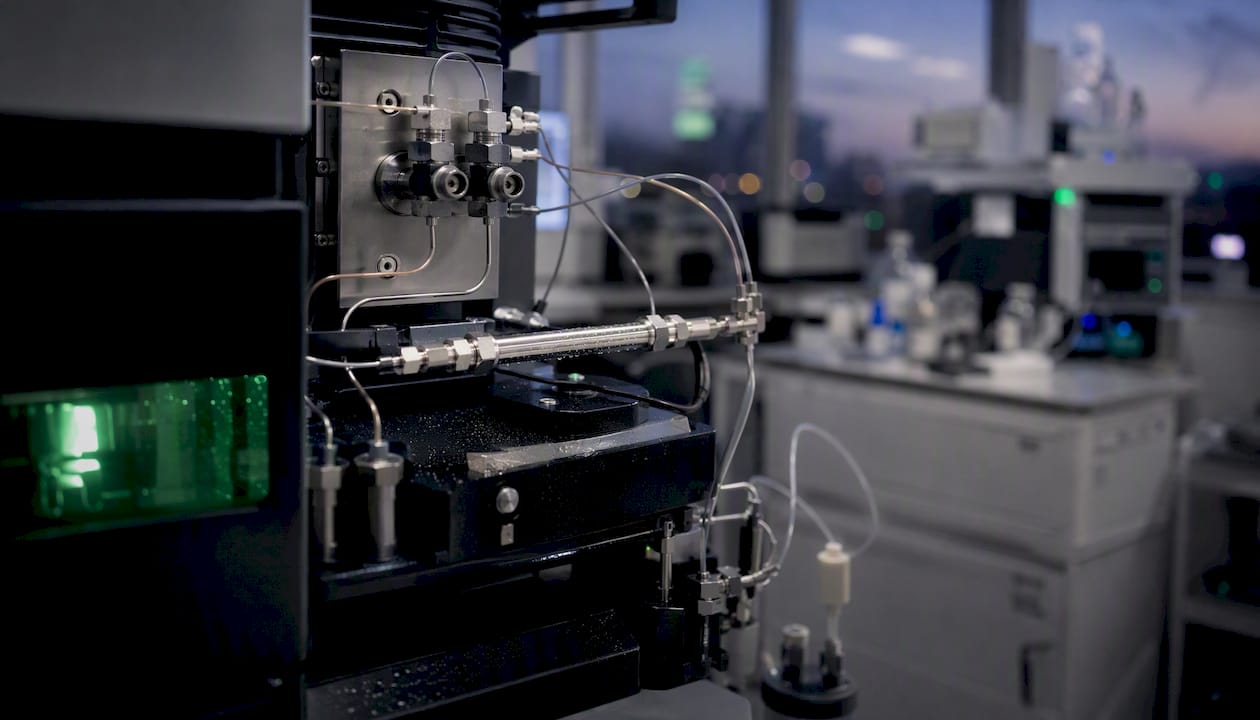
Nano-LC separates a complex peptide mixture by hydrophobicity on a reversed-phase C18 column, eluting peptides sequentially into the mass spectrometer. This separation is what makes it possible to identify thousands of peptides in a single run: without it, co-eluting peptides would suppress each other’s signals and overwhelm the instrument’s duty cycle.
Key nano-LC parameters a beginner will encounter:
- Column inner diameter: 50–150 µm; narrower columns give better sensitivity at the cost of higher clogging risk
- Flow rate: 100–300 nL/min; orders of magnitude lower than standard HPLC, which concentrates peptides at the source
- Gradient length: typically 60–120 minutes for discovery runs; shorter gradients (30 min) for targeted or high-throughput work
- Peptide peak width: 10–60 seconds at the base; narrower peaks mean better MS duty cycle but require faster scan rates
| Parameter | Typical range | Effect on data |
|---|---|---|
| Column ID | 50–150 µm | Narrower = higher sensitivity, more clogging risk |
| Flow rate | 100–300 nL/min | Lower = better ESI sensitivity |
| Gradient length | 60–120 min | Longer = deeper coverage, more IDs |
| Peptide peak width | 10–60 s | Narrower = better duty cycle |
Two failure modes beginners encounter most often: hydrophilic peptides (short, charged sequences) elute near the void volume and are frequently lost, while very hydrophobic peptides stick to the column and may not elute at all. For complex samples, offline high-pH reversed-phase fractionation before the LC–MS run (two-dimensional LC) substantially increases proteome depth compared to a single-shot run.
How MS/MS converts spectra into peptide identifications
MS1 tells you a peptide’s mass. MS/MS tells you its sequence. After the mass analyzer selects a precursor ion, it is isolated and fragmented, generating a ladder of smaller ions whose mass differences correspond to individual amino acid residues. The two dominant ion series are b ions (N-terminal fragments) and y ions (C-terminal fragments). Together, a complete b/y series can spell out the full sequence.
Common fragmentation methods:
- CID (collision-induced dissociation): the original method; peptide collides with inert gas; produces clean b/y ions; less effective for large or highly charged peptides
- HCD (higher-energy collisional dissociation): Orbitrap-specific variant of CID; higher energy gives more complete fragmentation and better immonium ions for PTM detection; the most common method in modern proteomics
- ETD (electron-transfer dissociation): transfers electrons to the peptide; produces c/z ions instead of b/y; particularly effective for phosphopeptides and intact glycopeptides because it preserves labile modifications
From spectrum to peptide ID
The standard pipeline runs as follows. The instrument selects a precursor in MS1, fragments it, and records the MS2 spectrum. A search engine then compares that spectrum against a theoretical database of all peptides expected from the target proteome. Three engines dominate: Mascot (Matrix Science), SEQUEST, and MSFragger. MSFragger is particularly fast and handles open searches for unexpected modifications. After the initial search, Percolator rescores peptide-spectrum matches (PSMs) using a semi-supervised machine learning model, and tools like MSBooster add deep-learning features such as predicted retention time and fragment intensities to further improve sensitivity. The full FragPipe pipeline wraps MSFragger, MSBooster, and Percolator into a single workflow.
Pro Tip: When inspecting an MS/MS spectrum, look for a continuous series of b or y ions with consistent spacing, not just a few isolated peaks. A spectrum with 5–6 consecutive ions in a series is far more convincing than one with 10 scattered peaks. Protein confidence also scales with unique peptide count: a protein identified by ≥2 unique peptides is considered a confident identification; a single-peptide hit warrants additional scrutiny.
Database searching is the default because it is statistically robust and computationally tractable. Its limitation is that it only finds what is in the database. For novel sequences (neoepitopes, antibody CDRs, non-model organisms), de novo sequencing reads the mass differences directly from the spectrum without a reference, though it is more error-prone and computationally intensive.
DDA vs. DIA and how to quantify peptides
The two dominant acquisition strategies differ in how they decide which precursors to fragment. In data-dependent acquisition (DDA), the instrument picks the most intense precursor ions in each MS1 scan and fragments them. This is intuitive and produces clean spectra, but the selection is stochastic: low-abundance peptides may never get selected, and the same peptide may be missed across replicates, creating missing values. DDA works well for discovery experiments where depth per run matters more than cross-run consistency.
Data-independent acquisition (DIA) takes a different approach. Instead of selecting individual precursors, the instrument cycles through wide m/z windows (typically 20–40 m/z each) and fragments everything within each window simultaneously. Every peptide above the noise floor gets fragmented in every run, giving more consistent coverage across samples. The trade-off is spectral complexity: because multiple peptides are co-fragmented in each window, DIA data requires spectral libraries or predicted spectra to deconvolute correctly. For quantitative experiments comparing many samples, DIA is increasingly the preferred choice.
Quantification strategies at a glance
- Spectral counting: counts the number of MS/MS spectra assigned to a protein; simple but high variance at low counts
- Label-free quantification (LFQ): compares extracted ion chromatogram (XIC) intensities across runs; no reagent cost, but requires careful normalization and stable retention times
- TMT / isobaric tags: chemical labels added to peptides before mixing; up to 18 samples run together; precise relative quantification but requires MS3 or careful ratio compression correction; TMT is the most widely used multiplexed labeling strategy
- SILAC (stable isotope labeling by amino acids in cell culture): metabolic incorporation of heavy amino acids; excellent accuracy but limited to cell culture systems and doubles sample complexity
MSFragger and FragPipe handle both DDA and DIA data and support TMT and LFQ quantification within the same pipeline, making them practical starting points for beginners learning computational proteomics.
How to judge whether your peptide IDs are trustworthy
Trust in peptide identifications is not binary. It depends on FDR control, unique peptide count per protein, replicate reproducibility, and the quality of individual MS/MS spectra. A result that passes all four checks is reliable; one that fails any of them deserves scrutiny before publication.
QC checklist for peptide MS data:
- Set peptide FDR to 1%: the standard decoy strategy (target-decoy competition) estimates the false discovery rate; 1% at the PSM level is the field norm; protein FDR is typically set separately at 1% as well
- Require ≥2 unique peptides per protein: a single peptide hit is not a protein identification; two non-overlapping peptides mapping to the same protein provide the minimum confidence threshold
- Check replicate consistency: coefficient of variation (CV) below 20% for LFQ intensities across technical replicates is a reasonable benchmark; high CV signals a sample-prep or instrument problem
- Inspect raw MS/MS spectra: open a representative spectrum in a viewer (PDV, Lorikeet, or the FragPipe built-in viewer); confirm that annotated b/y ions account for the major peaks
- Verify retention time consistency: the same peptide should elute within ±1–2 minutes across runs on the same column; large shifts indicate column degradation or gradient drift
- Run a blank and a standard: a blank injection between samples catches carryover; a peptide standard (e.g., a BSA digest or a synthetic peptide mix) confirms instrument performance before and after a batch
Pro Tip: Marginal PSMs with scores near the FDR threshold benefit from manual inspection, especially for PTM-modified peptides. Low fragment ion coverage or significant mass errors warrant cautious interpretation. Enrichment techniques prior to LC–MS often help identify low-abundance modified peptides.
Dynamic range is the other persistent challenge. A typical cell lysate spans 6–8 orders of magnitude in protein abundance, but a single LC–MS/MS run captures perhaps 3–4 orders reliably. High-abundance proteins (albumin in plasma, actin in cells) can suppress detection of low-abundance targets through ion suppression and duty-cycle competition. Depletion kits for abundant proteins or pre-fractionation are standard mitigations.
Glossary: key terms for reading methods sections
Every term below appears regularly in proteomics methods sections and figure legends. One line each.
- MS1: the first-stage mass spectrum recording intact precursor ion m/z values
- MS2 (MS/MS): the second-stage spectrum of fragment ions produced from a selected precursor
- m/z: mass-to-charge ratio; the x-axis of every mass spectrum
- Charge state: the number of protons (z) carried by an ion; determines where it appears in the m/z spectrum
- Isotope envelope: the cluster of peaks from the same peptide differing by one neutron (¹³C); spacing = 1/z Da
- Precursor ion: the intact peptide ion selected in MS1 for fragmentation
- PSM (peptide-spectrum match): a single assignment of a peptide sequence to one MS/MS spectrum
- FDR (false discovery rate): estimated fraction of incorrect PSMs at a given score threshold; typically controlled at 1%
- DDA (data-dependent acquisition): instrument selects the most intense precursors for MS/MS; stochastic
- DIA (data-independent acquisition): instrument fragments all ions within defined m/z windows; comprehensive
- TMT (tandem mass tag): isobaric chemical label enabling multiplexed relative quantification of up to 18 samples
- Orbitrap: high-resolution Fourier-transform mass analyzer (Thermo Fisher); sub-ppm mass accuracy
- TOF (time-of-flight): analyzer measuring ion flight time; fast, high mass accuracy
- Quadrupole: ion filter using oscillating electric fields; used for precursor selection and targeted MS
- Mascot: database search engine (Matrix Science) for peptide identification from MS/MS spectra
- SEQUEST: one of the original database search engines; scores PSMs by cross-correlation of theoretical and observed spectra
- MSFragger: fast, open-search-capable search engine integrated into the FragPipe pipeline
- Percolator: semi-supervised machine learning rescoring tool that improves PSM sensitivity and FDR estimation
- FragPipe: GUI-based workflow platform wrapping MSFragger, MSBooster, and Percolator for end-to-end proteomics analysis
- Spectral library: a curated collection of experimental MS/MS spectra used as references for DIA identification
How to verify peptide standards before running experiments
Verify peptide identity and purity via the supplier’s Certificate of Analysis (CoA) and a short in-lab standard run before relying on any peptide for calibration or quantification. A CoA that lacks a mass spec trace or an HPLC chromatogram is insufficient for research use.
What to check on a CoA:
- Peptide sequence: confirm it matches your target exactly, including any modifications
- Monoisotopic exact mass: compare against your calculated value; a discrepancy >0.02 Da warrants a recheck
- HPLC purity percentage: ≥95% is the minimum for most quantitative applications; Neolabpeptides supplies peptides at ≥98% purity verified by third-party HPLC
- MS trace: the CoA should show a mass spectrum confirming the correct molecular ion; check that the observed m/z matches the expected charge state
- Lot number and storage conditions: lyophilized peptides are stable at −20°C; reconstituted aliquots degrade faster
- RUO (research use only) label: confirms the peptide is supplied for laboratory research, not clinical or veterinary use
In-lab verification protocol: Prepare a dilution series of your peptide standard (e.g., 1, 5, 10, 50, 100 fmol on-column) and inject each concentration in triplicate. Plot MS1 peak area (XIC) against concentration. A linear response (R² ≥ 0.99) across at least one order of magnitude confirms the peptide is behaving predictably. Blank injections between each concentration level should return to baseline; persistent signal above 1% of the highest concentration indicates carryover.
Neolabpeptides includes third-party testing documentation with every product. Their CoA interpretation guide and third-party testing overview walk through exactly what each field means and how to cross-check it against your own MS data. All products are supplied for research purposes only and are not approved for human or veterinary use.
Statistic callout: Neolabpeptides verifies all research peptides at ≥98% purity through independent HPLC and mass spectrometry testing, with a Certificate of Analysis included with every order.
A practical perspective for beginners starting in proteomics
The single most useful thing a new proteomics researcher can do is run a well-characterized peptide standard before touching a biological sample. A BSA tryptic digest or a synthetic peptide mix tells you immediately whether your instrument is performing, your LC is stable, and your search settings are reasonable. Skip that step and you will spend days troubleshooting a biological problem that is actually an instrument problem.
Three starter experiments, in order:
- Peptide standard linearity: inject a synthetic peptide at 5–6 concentrations; confirm linear MS1 response and consistent retention time; this is your instrument baseline
- Single-protein digest: digest a purified protein (BSA, cytochrome C) and run it by LC–MS/MS; aim for >80% sequence coverage; this validates your sample-prep protocol
- Small complex sample with LFQ: run a simple cell lysate (3–5 µg) in triplicate with label-free quantification; check CV across replicates and total protein IDs
On the computational side, FragPipe with MSFragger is the most beginner-accessible pipeline for running a database search and inspecting PSMs. Load your raw files, select a FASTA database for your organism, set trypsin as the enzyme, and run with default settings first. Inspect the PSM table and open 5–10 spectra manually before trusting the summary numbers. Learning to read a spectrum is a skill that pays dividends across every experiment you will ever run.
Sources
- MSBooster / FragPipe paper - PMC
- UNM Mass Spec tutorial
- ABC of Peptide Sequencing by MS (course notes)
- EMSL PNNL — Bottom-up proteomics