

Interpreting HPLC Chromatograms: A Lab Checklist
The first thing to check on any HPLC chromatogram is baseline stability, because a drifting or noisy baseline undermines every measurement that follows it. Once the baseline looks clean, work through a short priority sequence rather than eyeballing the whole trace at once.
- Baseline: flat, low-noise, and returning to zero between peaks.
- Retention time: does the peak of interest land where your reference standard says it should?
- Peak area: is it integrated cleanly, with a defined start and end point?
- Peak shape: any tailing, fronting, splitting, or shouldering that flags a system or column problem?
Use peak area, not height, for quantitation, and always confirm compound identity against a reference standard or internal standard before reporting a result.
Key Takeaways
Accurate HPLC interpretation depends on stable baselines, retention-time matching against standards, and quantitation by peak area rather than height.
| Point | Details |
|---|---|
| Check baseline first | A flat, low-noise baseline is the prerequisite for trusting any peak measurement downstream. |
| Use area, not height | Peak area accounts for width variation and gives more reliable quantitation across injections. |
| Confirm identity properly | Match retention time to a reference standard run under identical mobile phase, flow, and column conditions. |
| Watch resolution and tailing | Resolution above roughly 1.5 and a tailing factor near 1.0 indicate a trustworthy separation. |
| Log everything | Recording run ID, solvent lot, and column age turns future artifacts into quick diagnoses instead of mysteries. |
Every quantitative result depends on the quality of the reference material behind your calibration curve. Neolabpeptides supplies research peptides verified at over 98% purity through third-party HPLC and mass spectrometry testing, with a Certificate of Analysis included for every lot. If you’re troubleshooting an unexpected chromatogram or setting up a new calibration series, starting with a peptide whose purity is already documented removes one major variable from your interpretation. Browse the Neolabpeptides catalog for lyophilized peptides built for laboratory research, not guesswork.
Table of Contents
- What Does an HPLC Chromatogram Actually Show?
- How Do You Identify Peaks in an HPLC Chromatogram?
- How Do You Quantify Compounds From Peak Area?
- What Do Peak Shape and Resolution Tell You?
- Why Do Chromatograms Show Drift, Noise, or Ghost Peaks?
- Isocratic or Gradient: How Does the Method Change Your Reading?
- What’s the Fastest Way to Interpret Any Chromatogram?
- What Do Analytical Standards Say About Method Selection?
- What Habits Actually Save Time at the Bench?
- Where Can You Learn More About Chromatogram Interpretation?
- Frequently Asked Questions
- Sources
What Does an HPLC Chromatogram Actually Show?
The x-axis is time, usually in minutes. The y-axis is detector response, most commonly reported in milli-Absorbance Units (mAU) for UV detectors, though voltage or counts appear depending on the detector type. A peptide eluting at 8.2 minutes with a response of 450 mAU simply means the detector recorded that much signal at that moment, nothing more, nothing less, until you interpret it against a standard.
Your chromatography data system (CDS), software like Empower, Chromeleon, or OpenLab, converts raw detector voltage into the chromatogram you see and handles the peak integration automatically. A few terms worth locking in before you go further:
- Baseline: the signal recorded when nothing is eluting.
- Peak: a rise and fall in response corresponding to a compound passing through the detector flow cell.
- Retention time (tR): the time from injection to peak maximum.
- Retention window: the acceptable tR range for a given compound, built from repeated standard injections.
Annotate a reference chromatogram with these labels once, print it, and pin it near your workstation. It pays off every time you train someone new.
How Do You Identify Peaks in an HPLC Chromatogram?
A peak has no identity until you assign one, and retention time comparison is the workhorse method for doing that.
- Run a reference standard of the suspected compound under identical conditions, same mobile phase, flow rate, column, and temperature, and record its tR.
- Compare retention times. Compound identification is commonly confirmed by matching an unknown peak’s tR against that standard, often expressed as relative retention time (RRT) to reduce day-to-day drift.
- Spike the sample. Add a small amount of standard to your unknown and re-run it. A single, enhanced peak supports identity; a shoulder or split suggests co-elution.
- Confirm with spectral data where available. A photodiode array (PDA) detector lets you compare UV spectra, and mass spectrometry (MS) gives you a molecular weight check that retention time alone can’t provide.
Method reproducibility matters more than people expect. A column swap, a two degree temperature shift, or a slightly different mobile phase batch can move retention times enough to cause a false negative.
Pro Tip: Keep a dedicated retention-time marker standard on hand and inject it at the start of every sequence. It takes five minutes and immediately tells you whether your system has drifted before you waste a batch of samples on questionable data.
How Do You Quantify Compounds From Peak Area?
Integration is where good chromatograms go bad if you’re not paying attention. The software picks start and end points for each peak based on slope-sensitivity settings, but auto-integration routinely misses shoulders, splits baseline incorrectly on tailing peaks, or clips the tail of a broad peak too early. Always inspect the integration events manually before trusting the reported area.
Area, not height, is the standard metric for quantitation. Peak height can mislead you when peak width varies between injections, and later-eluting compounds naturally broaden, which lowers their height without changing their true amount.
Building a calibration curve follows a predictable sequence:
- Prepare 5 to 6 standard solutions spanning your expected concentration range.
- Inject each standard and record peak area (or area ratio if using an internal standard).
- Plot area versus concentration and fit a linear regression.
- Confirm the R² value, generally above 0.995 for a usable curve.
- Apply the resulting equation to your unknown sample’s peak area.
A worked example: if your curve gives y = 15,200x + 320, and your unknown peak area is 91,520, solving for x yields a concentration of approximately a few mg/mL. Using an internal standard, you’d instead calculate the ratio of analyte area to internal standard area and apply that ratio to a ratio-based curve, which corrects for injection volume variability.
Pro Tip: Randomize or bracket your standard injection order rather than running low to high concentration in a straight line. It reveals systematic drift, and running each sample in triplicate gives you a fast estimate of injection precision without much extra bench time.
What Do Peak Shape and Resolution Tell You?
A chromatogram can have perfect retention times and still be unusable if the peaks are poorly shaped. Several metrics tell you whether a run is trustworthy:
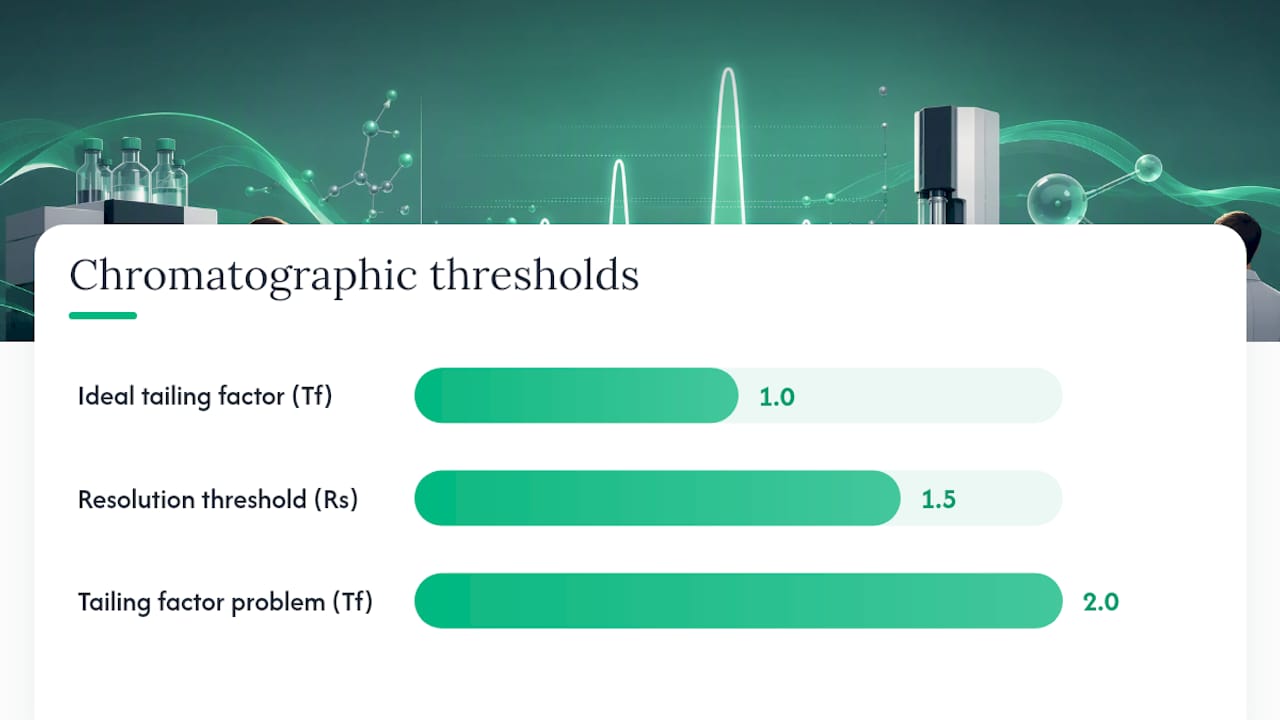
- Tailing factor (Tf): ideally close to 1.0; values above 2.0 suggest column degradation, sample overload, or secondary interactions with residual silanols.
- Theoretical plates (N): a measure of column efficiency; higher N means sharper, narrower peaks.
- Capacity factor (k): describes how strongly a compound is retained relative to the void volume.
- Resolution (Rs): the separation between two adjacent peaks.
Chromatographic performance is governed by retention (k), selectivity (α), and efficiency (N), and resolution above roughly 1.5 is generally accepted as the threshold for baseline separation between two compounds.
Fronting, a peak that rises gradually and drops sharply, usually points to column overload or a void forming at the column head. Tailing more often signals active sites on the stationary phase interacting with your analyte. Either defect distorts integration and inflates your quantitation error, so treat a Tf above 2.0 or an Rs below 1.5 as a signal to investigate before you report results, not after.
Why Do Chromatograms Show Drift, Noise, or Ghost Peaks?
Most chromatographic artifacts trace back to a short list of usual suspects, and working through them in order saves time.
- Baseline drift: check mobile phase equilibration, column temperature stability, and detector lamp age first.
- Excessive noise or spikes: look for air bubbles, particulates, or a failing degasser.
- Ghost peaks: these often come from carryover, contaminated mobile phase, or column bleed; run a blank injection to isolate the source.
- Carryover between injections: increase needle wash volume or extend the wash cycle.
Work through solvent quality and degassing first, then pump pressure stability, then injection sequence, then column condition, and finally detector lamp status and zero calibration.
Pro Tip: Log the run ID, solvent lot number, and column age alongside every sequence. When an artifact shows up three weeks later, that log turns a guessing game into a five-minute diagnosis.
Isocratic or Gradient: How Does the Method Change Your Reading?
Isocratic runs use a fixed mobile phase composition throughout, which works fine for simple mixtures or fast potency assays. Gradient elution ramps solvent strength over time and gives you higher peak capacity for complex samples with a wide polarity range.
- Detector choice changes what you can see: UV is standard and economical, PDA adds spectral confirmation, ELSD detects compounds with no UV chromophore, and MS gives you mass confirmation.
- Gradient runs shift retention time comparisons. Always match gradient profile, not just column and flow rate, when comparing tR across different runs.
- Switch to gradient once your sample has more than four or five components spanning a broad polarity range, since isocratic separations tend to bunch early peaks and stretch late ones.
What’s the Fastest Way to Interpret Any Chromatogram?
Run through this sequence on every chromatogram before you trust the numbers it gives you.
- Confirm baseline is flat and system suitability standards pass.
- Check retention time against your reference window.
- Inspect integration start and end points manually.
- Evaluate peak shape (tailing factor, resolution from neighbors).
- Record area, calculate concentration, and note replicate agreement.
- Log any anomalies in your notebook or CDS audit trail before moving on.
Each step takes under a minute once it’s habit, and the documentation step protects you the next time someone questions a result.
What Do Analytical Standards Say About Method Selection?
- Choose LC mode (RPLC, HILIC, NPLC) based on analyte polarity and ionization behavior, and adjust mobile phase pH for ionizable analytes to sharpen selectivity.
- Report mobile phase composition, column identity, flow rate, temperature, and detector settings in full for reproducibility.
- Consult primary method-selection literature before adapting a protocol to a new, complex matrix.
What Habits Actually Save Time at the Bench?
Keep a retention-time marker standard on hand, run a quick QC injection at the start of every batch, and maintain a plain-text method-change log. These three habits catch drift before it wastes a full sequence.
A worthwhile small investment: fresh solvent bottles, inline filters, and a periodic column health check with a known test mix. When a peak looks ambiguous, don’t guess. Re-run it with a spiked standard or switch to an orthogonal detector before you report anything.
Where Can You Learn More About Chromatogram Interpretation?
- For axis and detector basics, see the JASCO introduction to HPLC.
- For identification and quantitation workflows, consult the Waters primer on identifying and quantitating compounds.
- For method selection and mobile phase optimization, review the RSC Analytical Methods technical brief.
- For resolution, efficiency, and gradient versus isocratic tradeoffs, see ChromatographyOnline’s essence of modern HPLC.
Cite these when reporting analytical methods or defending a system suitability decision to a reviewer.
Frequently Asked Questions
Why does peak height sometimes disagree with peak area for the same compound? Peak width changes with retention time and column efficiency, so a broader peak can have lower height but the same or larger area. Area accounts for the full peak profile, which is why it’s the standard for quantitation.
What causes two peaks to overlap or co-elute? Similar polarity or molecular structure between compounds often causes co-elution. Switching to gradient elution, changing the LC mode, or adjusting mobile phase pH can improve separation, and an internal standard helps you quantify accurately even when partial overlap remains.
How do you calculate signal-to-noise ratio for limit of detection? Signal-to-noise ratio compares peak height to the baseline noise amplitude in a blank region. A ratio around 3:1 is typically used for limit of detection, while 10:1 is common for limit of quantitation, though your method’s validation protocol should specify the exact criteria.
What’s the difference between baseline correction and integration? Baseline correction adjusts for drift or slope in the signal between peaks, while integration defines where a peak starts and ends for area calculation. Poor baseline correction directly distorts integration accuracy, so fix the baseline before trusting any reported area.
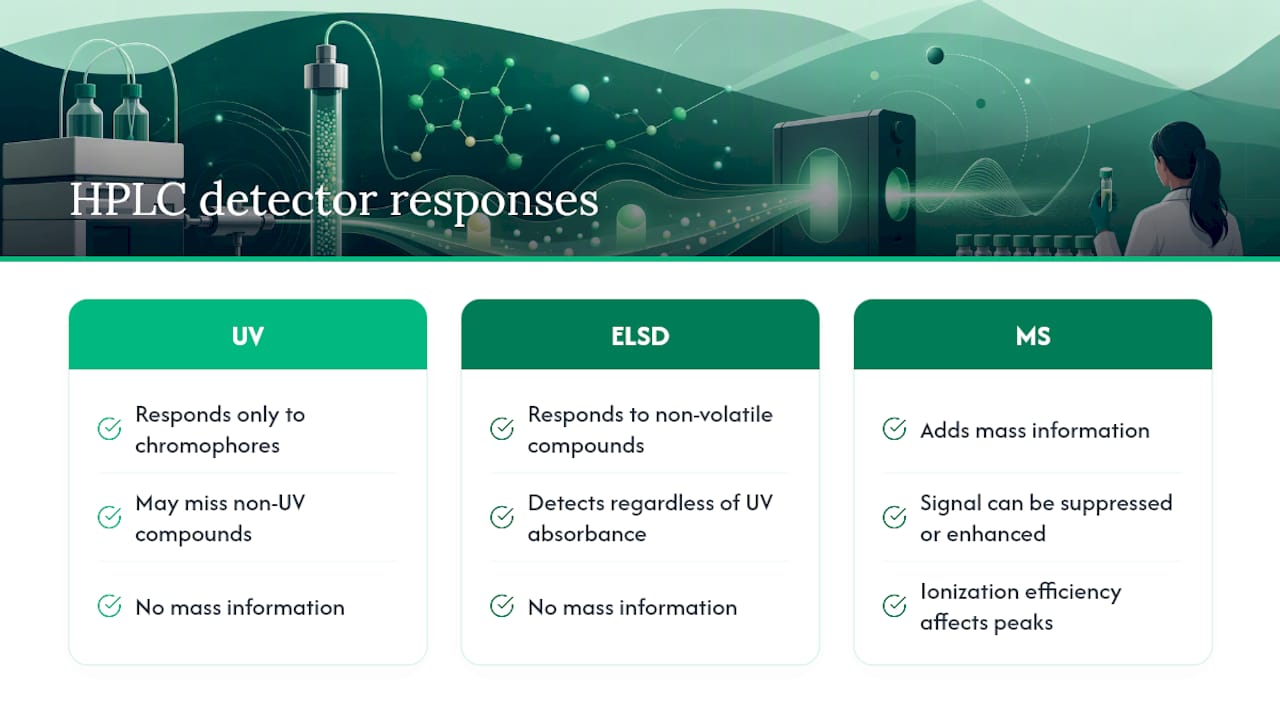
Do all detectors show the same chromatogram for the same sample? No. A UV detector responds only to chromophores, ELSD responds to non-volatile compounds regardless of UV absorbance, and MS adds mass information but can suppress or enhance signal depending on ionization efficiency. The detector you choose shapes what peaks you see at all.
Sources
- Introduction to HPLC — JASCO learning center
- Identifying and quantitating compounds — Waters primer
- Method selection for liquid chromatography — RSC Analytical Methods
- The essence of modern HPLC — ChromatographyOnline